

Ethereum price updated its all time high to $4950, followed by a swift correction to $4,270, and now technical indicators suggest an upcoming bullish rally to $6,500.
Ethereum price declined due to profit-taking, and now it trades at $4450. This volatility comes from mixed market sentiments because analysts note bullish long-term views; however, the risk of short-term corrections is still there. This has put the Ethereum Crypto Fear and Greed Index at neutral levels around 48 to 50.
The overall cryptocurrency market remained upward in August, with total market cap exceeding $4 trillion. Ethereum’s movements closely track Bitcoin’s gains, however, Bitcoin is still trading below $110,000, and Ethereum’s price has outperformed it with a 36% monthly rise. Compared to other altcoins, Ethereum leads many altcoins, including Solana, XRP, and Dogecoin, as they fail to match the momentum.
Ethereum ETFs are also showing major interest from traditional traders. The Cumulative Spot Ethereum ETF Volumes are currently sitting at an all-time high. The consistent upward curve, with no major pullbacks, shows that ETF inflows are becoming a structural force behind Ethereum’s price action.
Ethereum Current Price Action
Ethereum is showing a bearish breakout from a triangular pattern in the short term. The marked points A, B, C, and D form a symmetrical triangle as the price remains in a tug of war between bulls and bears as prices converge toward a potential breakout.

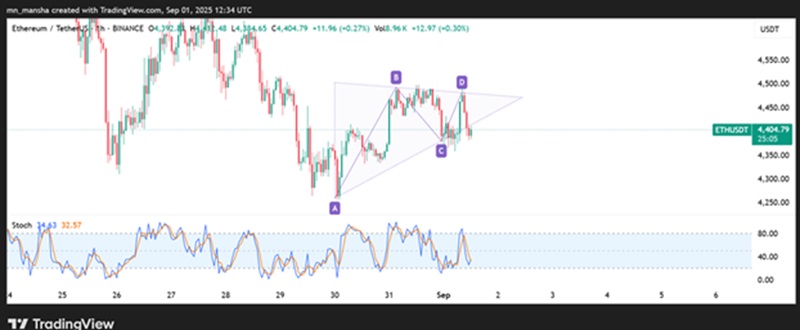
The stochastic oscillator is at 34.63 and 32.57, and this is an oversold condition that could precede a rebound, while the overall crypto market shows neutral sentiment.
This movement indicates consolidation after an initial surge from around $4,200 in mid-August, where the ETH price climbed sharply before facing resistance and pulling back due to profit-taking across the market.
If the triangle breaks upward, Ethereum could target $4,800 or higher, buoyed by positive long-term views and ETF inflows exceeding $1 billion last week, though a downward break might test $4,200 support amid broader market caution in September.
Ethereum to $6,500?
The price of Ethereum is moving in a bullish direction after a healthy correction due to profit-taking at the top. Ethereum’s price structure is developing inside a well-defined upward channel, and the Fibonacci extensions drawn from its recent breakout point suggest where momentum may carry it next – and that is a bullish direction.

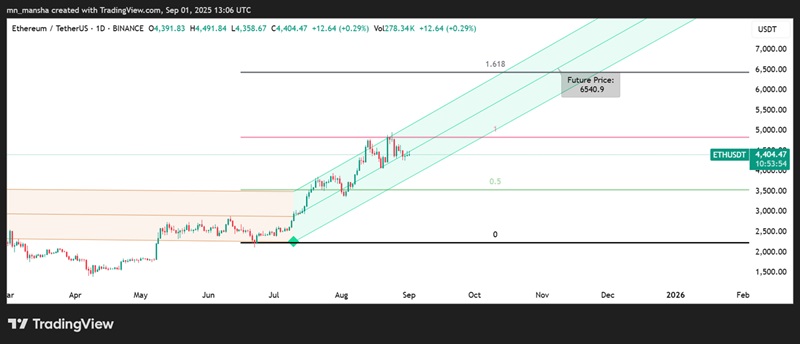
The mid-levels of the channel have acted as strong support during pullbacks, keeping the overall trend mainly bullish. As price continues to respect this rising structure, the higher extension levels come into play, and the 1.618 Fibonacci target aligns closely with $6,500, which is the expected next all-time high, based on these two technical indicators.
This convergence of technical indicators makes the level more than a random projection. It is a point where trend and mathematics meet, and the market sentiment perfectly aligns with this target. If the bullish price channel moves the same, the price target of $6,500 seems very reasonable.
The Odds of $6,500
The odds of Ethereum reaching $6,500 must be weighed against how the overall market is functioning right now. There are entities with enough capital to move prices, and their influence is visible across altcoins like Solana and Ethereum.
But pushing an asset of this size is not simple. It demands both large amounts of market cap and time, and no single move can work without the support of Bitcoin’s price. The challenge is that the same players rotating funds across the market can usually afford to push either Ethereum or Bitcoin, not both at once, because it requires trillions of dollars to do so.
This tug-of-war creates periods where one asset is strongly bullish while the other one slows and waits for its turn, and understanding that rotation is key to seeing how Ethereum could build enough momentum to test $6,500.