

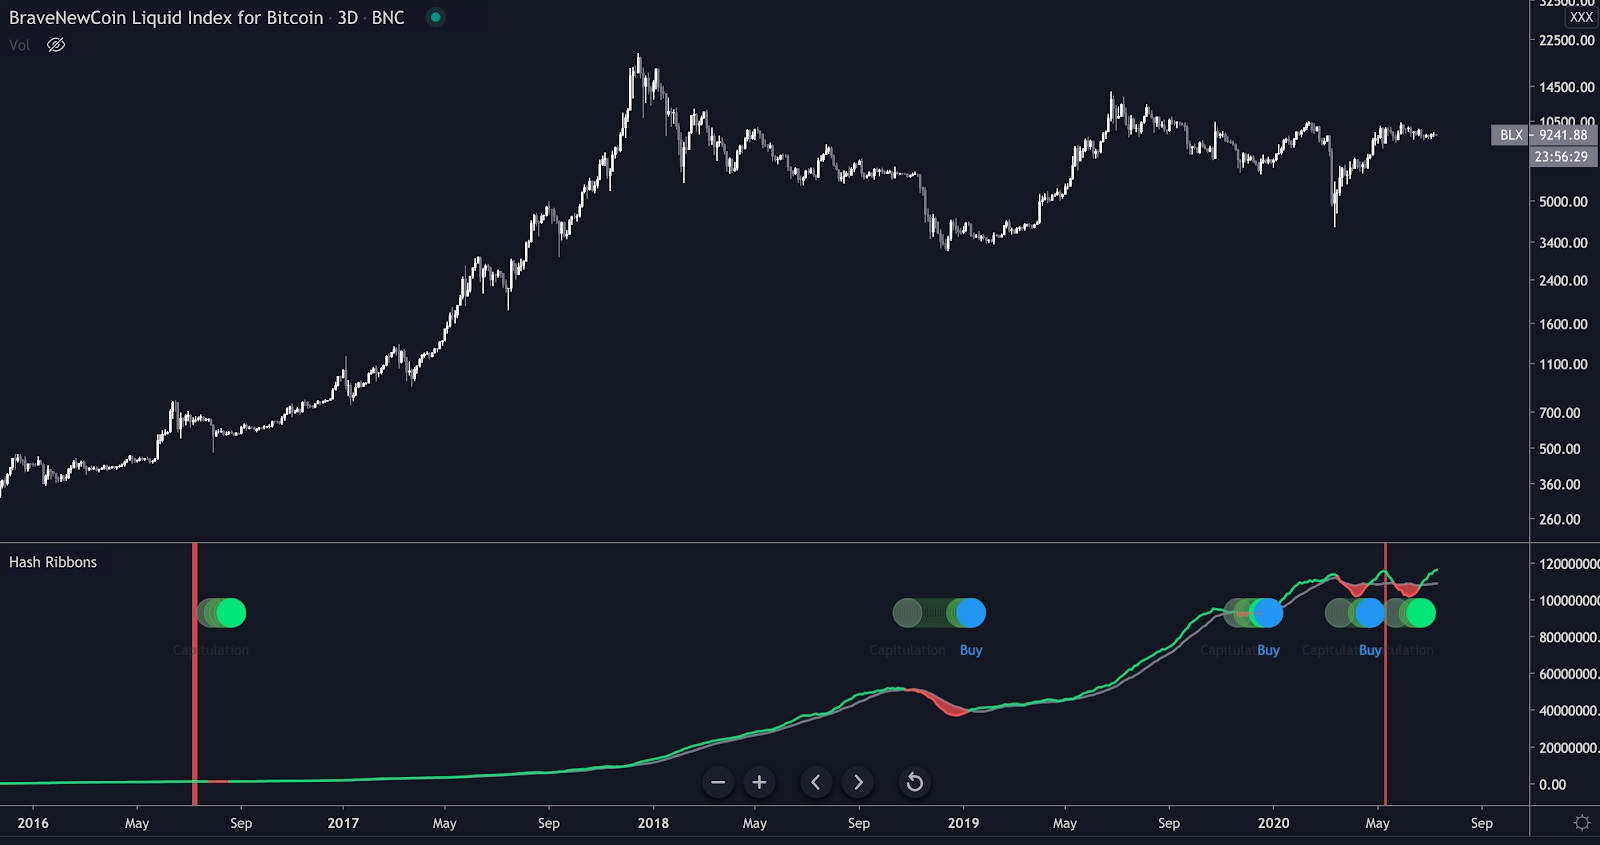
The previous time the Hash Ribbon pattern came up was on April 25, when Bitcoin was trading at $7,500.
From that time, BTC gained ground against the dollar to hit $10,440, reflecting a gain of 39% relative to the peak recorded in June.
Edwards stated:
“Bitcoin Hash Ribbons ‘Buy’ signal just confirmed. The post-Halving signal is particularly special. It will probably be a very long time until the next occurs. …and so the great bull run begins.”
Earlier, Edwards detailed that the Hash Ribbon signal presents itself roughly once per year. The macro indicator plays a part in the hash rate and mining difficulty of the Bitcoin blockchain network.
The fundamental theory behind the functioning of Hash Ribbon indicator is that the Bitcoin market starts drifting towards a bottom when crypto miners start diluting their holdings.
Hash Ribbon Buy
The Bitcoin Buy signal which occurs about once a year just fired.
Note: The halving is just 2 weeks away. Expect another signal within the next 3 months, like 2012 and 2016. pic.twitter.com/xFGG4HSMOH
— Charles Edwards (@caprioleio) April 25, 2020
Miners often liquidate or dilute BTC when Bitcoin becomes too costly to mine. That normally happens when Bitcoin’s price undergoes extreme price correction i.e., when it goes close to or declines below the breackeven cost of mining.

In the research report published last October 2019, Edwards wrote:
“Because of the effect of negative sentiment and price action during deep bear markets and times of miner capitulation, the best time to buy Bitcoin is typically somewhere in the middle of the ‘miner capitulation’ period.”
We are in the #BTC accumulation phase.
The 30- and 90-day moving average gap of all exchanges' reserve represents the downside risk. It hit a record low in May this year and is still below zero. pic.twitter.com/IsljYG6h0Z
— Ki Young Ju (@ki_young_ju) July 13, 2020
The indicator assesses overall market sentiment and likely miner liquidation by employing the one-month and two-month simple moving average of Bitcoin’s hash rate.

The Hash Ribbon pattern was seen twice this year due to halving. Going back, the pattern was never formed twice in a single year, on average.
Before May 11 halving event, the indicator showed that miners were diluting their positions.
At that time, there was no clarity on the breakeven cost of mining and there was no clear view about the price trend of Bitcoin.


Following the halving event, the market sentiment was diverse as BTC/ISD underwent an unexpected price correction to $3,600 in March.
The electricity costs are anticipated to decline considerably due to rain in Sichuan region where a large number of mining centers are functioning. Subsequently, the cost of Bitcoin mining declined to just $5,000 in some Asian regions.
The Hash Ribbon pattern was likely formed again as Bitcoin mining hit a new record difficulty. The sentiment surrounding Bitcoin market continues to stay segregated.
Some traders point out that a near-term reversal is looming. But others trust that as it happened two years before, a prolonged uptrend is forthcoming as investors continue to increase.
Ki Young Ju, CEO at blockchain analytics firm CryptoQuant said “We are in the BTC accumulation phase. The 30- and 90-day moving average gap of all exchanges’ reserve represents the downside risk. It hit a record low in May this year and is still below zero.”
On the contrary, analysts have a positive view about the Hash Ribbon indicator and its effect because of documented precision.
Cantering Clark, cryptocurrency trader and hedge fund manager stated:
“The fundamental stuff with regards to crypto is not in my wheelhouse. Going off my system still gets me behind the moves eventually. Can someone tell me though, why will this time be different for the Bitcoin Hash Ribbon Buy signal?”
The indicator’s sampling size has been a subject of criticism in former times. As the indicator shows a tendency to crop up only once per year, there is likelihood it only tracks the long-term price movement of BTC. It can be also argued that the indicator only tracks the price appreciation of BTC over a time span.