

Professionals provide three reasons for the sharp decline in the price of Bitcoin. They are CME price gap, critical resistance and multiple monthly moving averages. Bitcoin futures is not traded in the CME futures market on holidays and also on weekends.
This implies that if Bitcoin witnesses a huge price movement during weekends or on holidays in the spot market, a gap opening usually happens on the CME futures exchange.
While the gaps in futures market get filled often, there is no proven theory explaining the reason behind traders’ strategy of filling gaps in CME futures. Since the beginning of last month, Bitcoin has witnessed robust rally.
During the weekend, the Bitcoin transaction volume tends to decline as volatility decreases. However, in the past few months, Bitcoin has been exhibiting a pattern of uptrend during weekends without any drop in transaction volume.
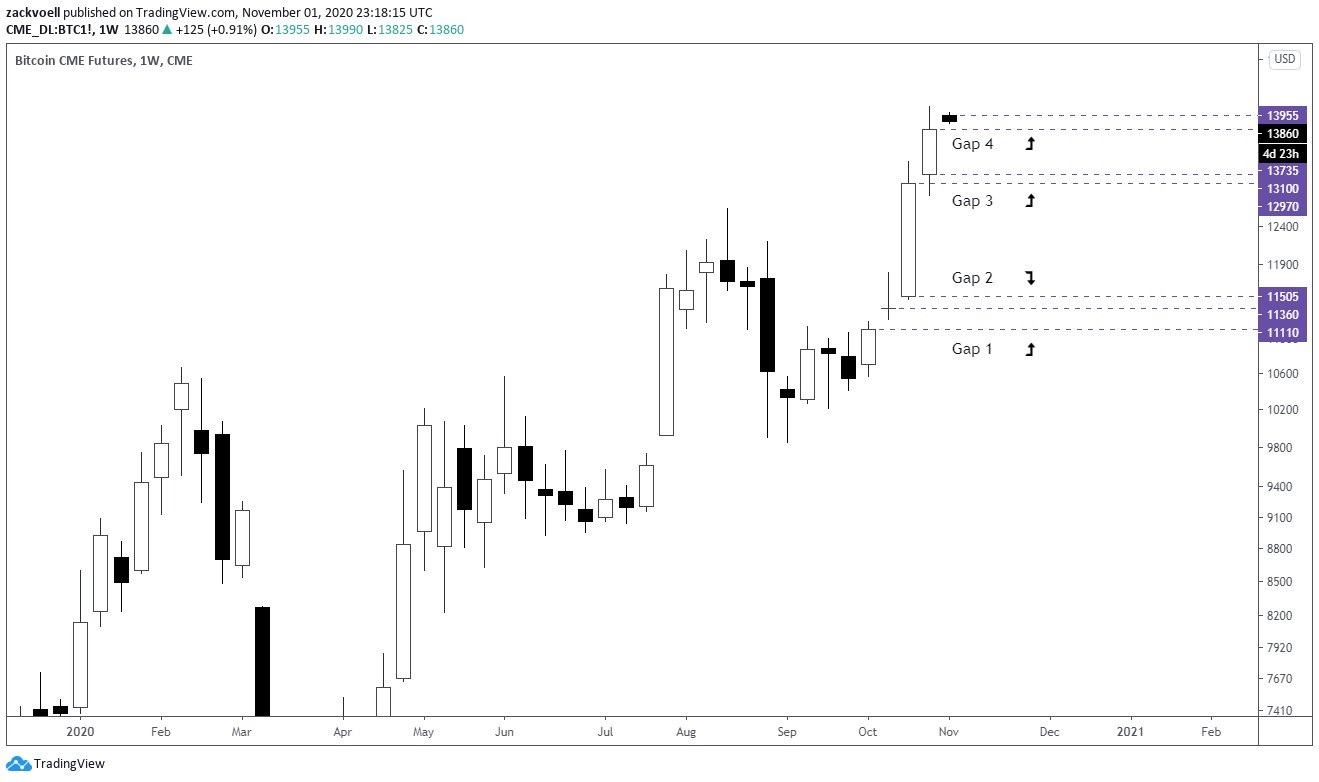
Subsequently, this resulted in the creation of four successive CME gaps. Every weekly candle in the last month resulted in the formation of a new CME gap, which is unusual for Bitcoin. It implies that Bitcoin has trended so quickly even on weekends that fresh successive gaps have been created.
Currently, gaps are seen at $13,100, $12,970, $11,505 and $11,100. These zones could regarded as levels of significance for sellers. Incidentally, the zone between $12,970 and $13,100 is also a crucial with respect to moving averages (MAs).
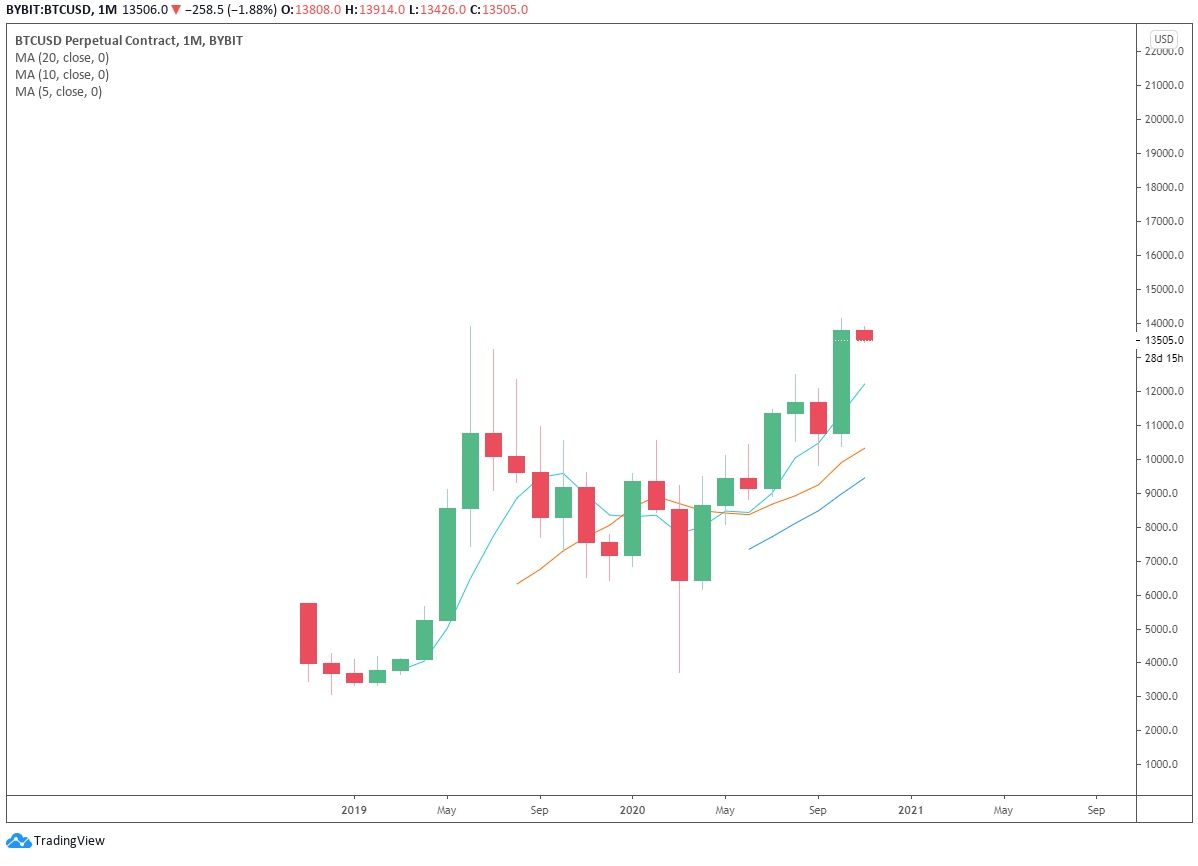
In Bitcoin’s monthly chart, the 5-day moving average is the immediate short-term moving average at $12,203. In the course of history, even when the market was bullish, a minimum of one short-term MA on monthly chart was tested before the rebound.


Bitcoin surged sharply since early October, appreciating by over 25% from $11,775 to $13,500. The rate of uptrend implies Bitcoin was unable to form precise support levels on charts with higher time frame.
Over the last two months, Bitcoin has replicated the trend of sharp rally followed by a short period of consolidation. On the daily chart, this formed precise support and resistance levels, transforming the rally into lasting ones, compared to earlier moves.
The weekly and monthly chart, nevertheless, indicates that considerable gap exists between the price of Bitcoin and significant short-term moving averages. The nearest moving-average is the 5-day moving average that exists at $12,200.
For the first-time since December 2017, pn October 31, Bitcoin tried to break above the resistance level of $14,000. Experienced traders anticipated a sharp retracement after testing the resistance level.
However, a section of traders opined that they were taken off guard with the severity of Bitcoin price drop. Later on, the high open interest in the futures market made them realize that the drop had a firm reason behind it.
A trader going by nickname CL said “Once in a while I’m actually surprised by a move.”
Subsequently, CL stated that the open interest was fairly high to support that kind of action. “Actually nvm, I miss read how much open interest was rising earlier, this makes sense.”