
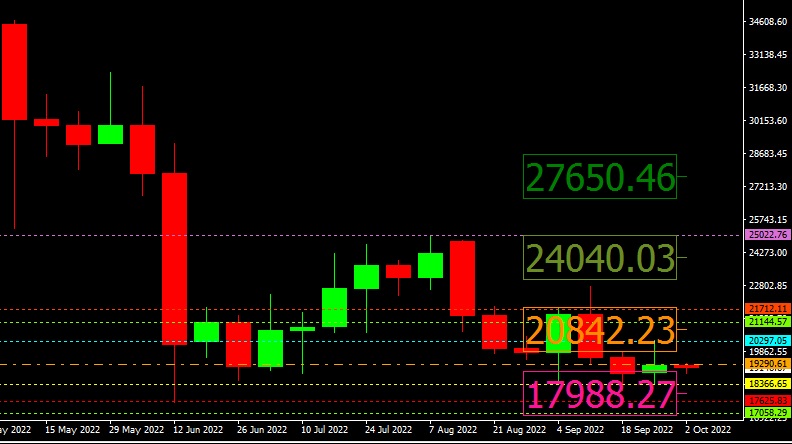
Weekly chart
The weekly chart indicates that major support and resistance levels are 17988 and 20842 for Bitcoin. Other formidable levels within this band are 18366, 19290 and 20297. A close watch will reveal that Bitcoin tried to break both 20297 and 19290 levels last week, but failed due to heavy selling pressure. The cryptocurrency closed 19203. In the earlier week, Bitcoin, which hit a low of 18123, garnered support at 18366 to close at 18887. Therefore, it is highly likely that Bitcoin will once again test the support level of 18366 and even 17988. Unless Bitcoin breaks above 19290, it will be prudent to hold a short position. A break below 18366 will increase selling pressure and Bitcoin will find it difficult to rebound for the rest of the week. Likewise, a break above 20297 will make the crypto extremely bullish, leading to huge short coverings. In such a scenario, Bitcoin will not come down for the rest of the week.

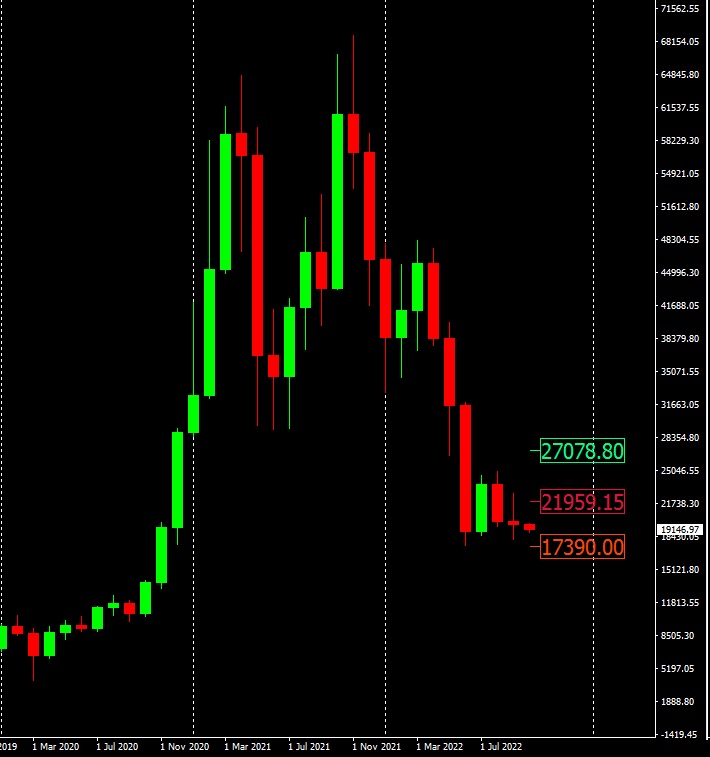
Monthly chart
The monthly chart indicates that Bitcoin has got rejected multiple times at 21959. The next major support is at 17390. On the upper side, the major resistance, in case it breaks 21959, is at 27078. With the sentiment being slightly bearish, the probability of breaking 21959 is very less. As both the weekly and monthly chart indicates likely downward correction, there is a high chance of a fresh downward trend to begin sometime this week. Unless, the major weekly resistance levels get broken, it would be better to stay short and wait for a rebound at the major support levels.