

Bitcoin’s 4-year cycle is its playbook, which determines price swings in the given timeline, but this time it’s different.
Bitcoin’s price cycle has historically followed a rough four-year rhythm tied to halvings. Bitcoin halving roughly occurs every 4 years, and that’s when the miners’ reward gets halved. This greatly impacts the price of Bitcoin, and it makes highs and lows accordingly. This pattern consistently sees a period of accumulation and steady growth post-halving, followed by a parabolic price surge, and then a significant correction, ultimately leading to a market bottom right before the next halving event.

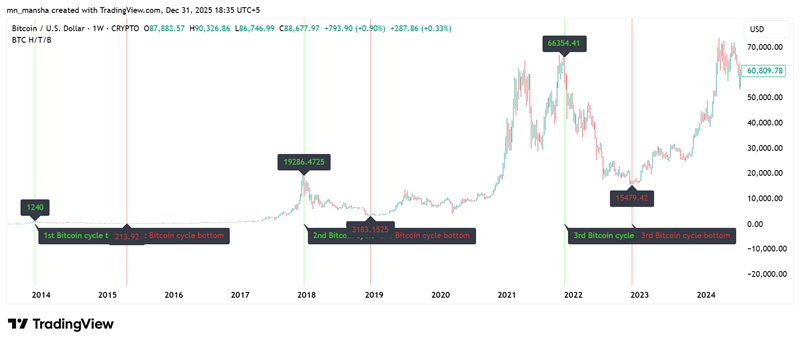
- First Cycle (Post-2012 Halving): After the first halving in November 2012, where the block reward fell from 50 BTC to 25 BTC, Bitcoin’s price went from around $12 to an all-time high of over $1,100 by late 2013.
- Second Cycle (Post-2016 Halving): Following the July 2016 halving to 12.5 BTC, a period of consolidation gave way to an explosive rally. The price surged from $660 to nearly $20,000 by December 2017, before seeing a significant multi-year decline.
- Third Cycle (Post-2020 Halving): The May 2020 halving, which cut rewards to 6.25 BTC, was the reason for a bull run that pushed the price from around $8,600 to a peak near $69,000 in November 2021.
- Current Cycle (Post-2024 Halving): The most recent halving in April 2024 saw the reward decrease to 3.125 BTC. Interestingly, the price hit new all-time highs before the event this time, a break from historical patterns.
Why Bitcoin price seem broken?
It’s the time, not just the price, that defines whether Bitcoin is moving in the cycle or not. In previous cycles, Bitcoin followed a repeatable sequence. After each halving, it took the price 80 weeks to reach a new all-time high of the cycle. That phase of 80 weeks is called the profit window. Once it closed, momentum faded, and a broader distribution phase took over, leading the price to the bottom. Also, the full expansion from the cycle’s bottom to the cycle’s top took around 140 to 150 weeks, with only minor variations.


It’s different this time. The chart above shows the structure of the 2016 and 2020 cycles. The peaks arrived on schedule, and the market respected those time boundaries even when price targets differed. What matters here is the time-capped upside, not sentiment.
Now look at the current cycle. The 4th halving occurred in April 2024. The market has already moved beyond the historical 80-week profit window, but the price failed to extend beyond the projected peak zone. If the pattern held, the move toward new highs should still look impulsive. Instead, price stalled and rotated. Based on that timing model, $126k already marks the cycle’s terminal high, not a midpoint.
The market did not collapse. It simply stopped behaving the way the old cycle model required. This drift from the old cycles is likely due to ETF-driven liquidity, capital rotations, and the crypto-friendly Trump government, which is also responsible for the stretched profit window beyond the previous 80 weeks.
The next Bitcoin halving is in less than 840 days. If the four-year cycle no longer governs market behavior, investors cannot rely on predictable post-halving expansions, and Bitcoin becomes more unpredictable, which means capital allocation becomes more tactical, rallies shorten, and long-term investors rely more on the market fundamentals. Technical analysis tools become less predictable. Altcoins, which rely on Bitcoin’s peak and bull run, suffer the most from it as they rely on excess liquidity and speculative rotation. The capital remains stuck in BTC, leaving no room for the altcoins to grow. This makes a classic “alt-season” challenging to ever occur in the future.
In short, with Bitcoin’s 4-year cycle broken, the asset has shifted from a “buy and hold” strategy to a focus on institutional flow and global macro trends. This increased unpredictable behavior makes the asset more interesting for the investors while making it harder for the altcoins to catch up.