
S&P 500 Rally
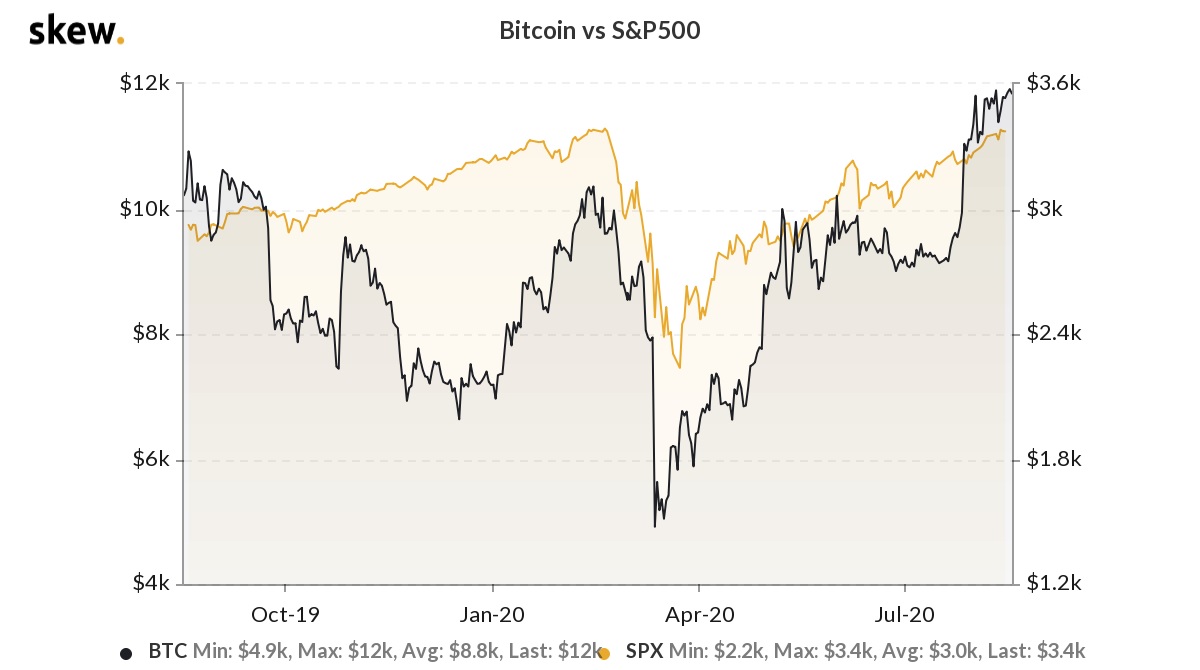
As Bitcoin remains bullish, analysts are closely monitoring other markets to determine whether there is any provable correlation. The reversal in the stock market was led by China, with several stocks listed in Shanghai market hitting two year highs on reports of further policy easing by the People’s Bank of China. The Shanghai Composite Index ended Monday with a gain of 2.3%. So far this year, the index has rallied 13%, in spite of the Covid-19 disruption. The S&P 500 has gained 50% from the low recorded in March, with Goldman Sachs analysts upwardly revising its FY20 forecasts to 3,600 points. The index is just 14 points away from the pre-pandemic February high.
Commenting on the rally, Goldman’s David Kostin said “As the last few months have demonstrated, equity prices depend on not just the expected future stream of earnings but the rate at which those earnings are discounted to present value. Looking forward, a falling equity risk premium will outweigh a rise in bond yields, and combined with our above-consensus EPS forecast, will lift the S&P 500 Index to 3,600 by year-end.”
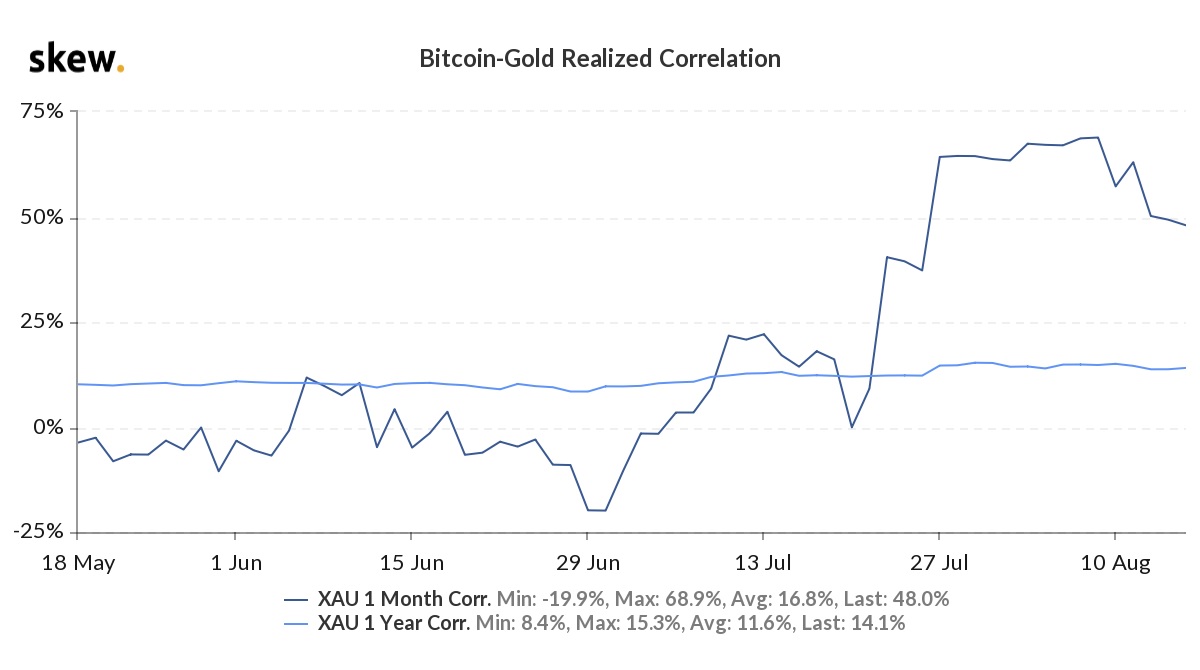
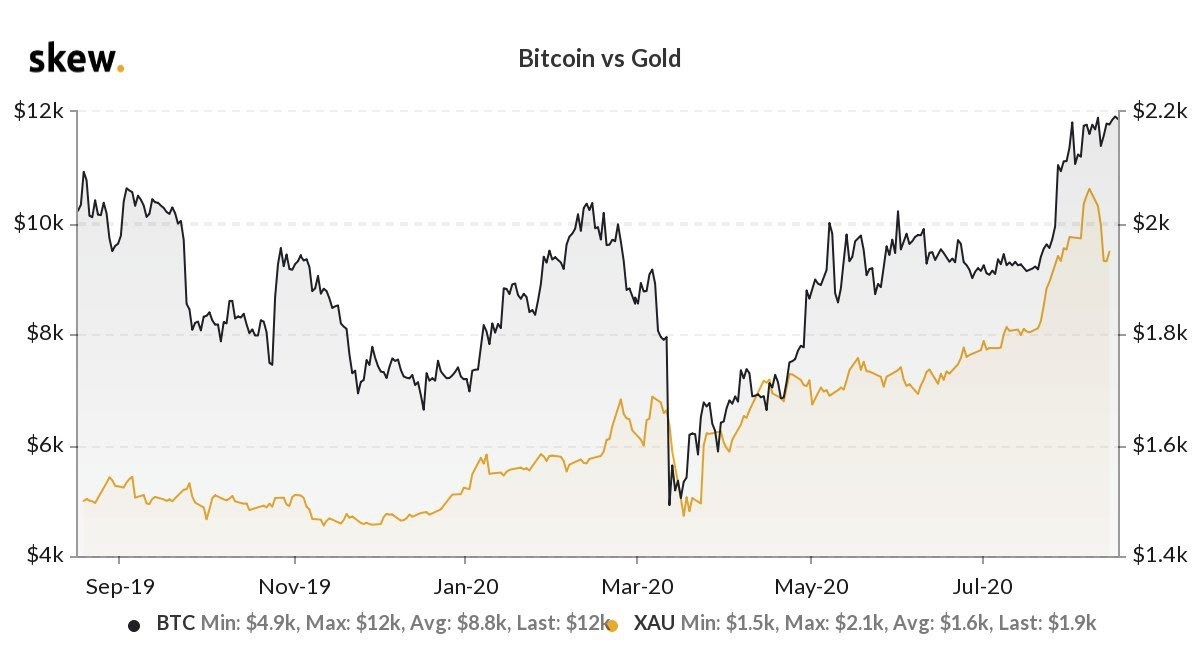
The S&P 500 already has a correlation of 95% with Bitcoin. However, Bitcoin’s correlation with gold has declined after the latter fell below $2,000, from 68% to 48% in August, as per the latest data.

Analysts expects stiff resistance at $12,000 level
Bitcoin also faces resistance in the form of change in sentiment. The level of $12,000 is giving tough resistance for the cryptocurrency, with several failed attempts to cross the level in the past two weeks. The resistance, however, is technically weak and many analysts are expecting the level to be breached in the weeks ahead. The argument also receives support from the fact that many altcoins continue to forge higher, while Bitcoin remains range bound (perceived as consolidation). That is construed as a bullish sign, specifically following the sharp rally sparked by demand earlier this month. During last weekend, analyst Michaël van de Poppe opined that the resistance could be strong enough to trigger a decline to a level of 10,500. He also expects a rebound from that level to break the minor resistance at $12,000 and turn that into a support.
Van de Poppe tweeted “Given the significance of this level, I’m starting to think this is becoming a very likely scenario. However, a clear break and flip of $12K are continuations towards $13K and possibly $15-17K area.”
Once the level of $12,000 is crossed, analysts do not see any major hurdles in reaching $20,000, the all-time high recorded in 2017.
Given the significance of this level, I’m starting to think this is becoming a very likely scenario.
However, a clear break and flip of $12K are continuations towards $13K and possibly $15-17K area. pic.twitter.com/jSeAuyRhCp
— Crypto Michaël (@CryptoMichNL) August 15, 2020
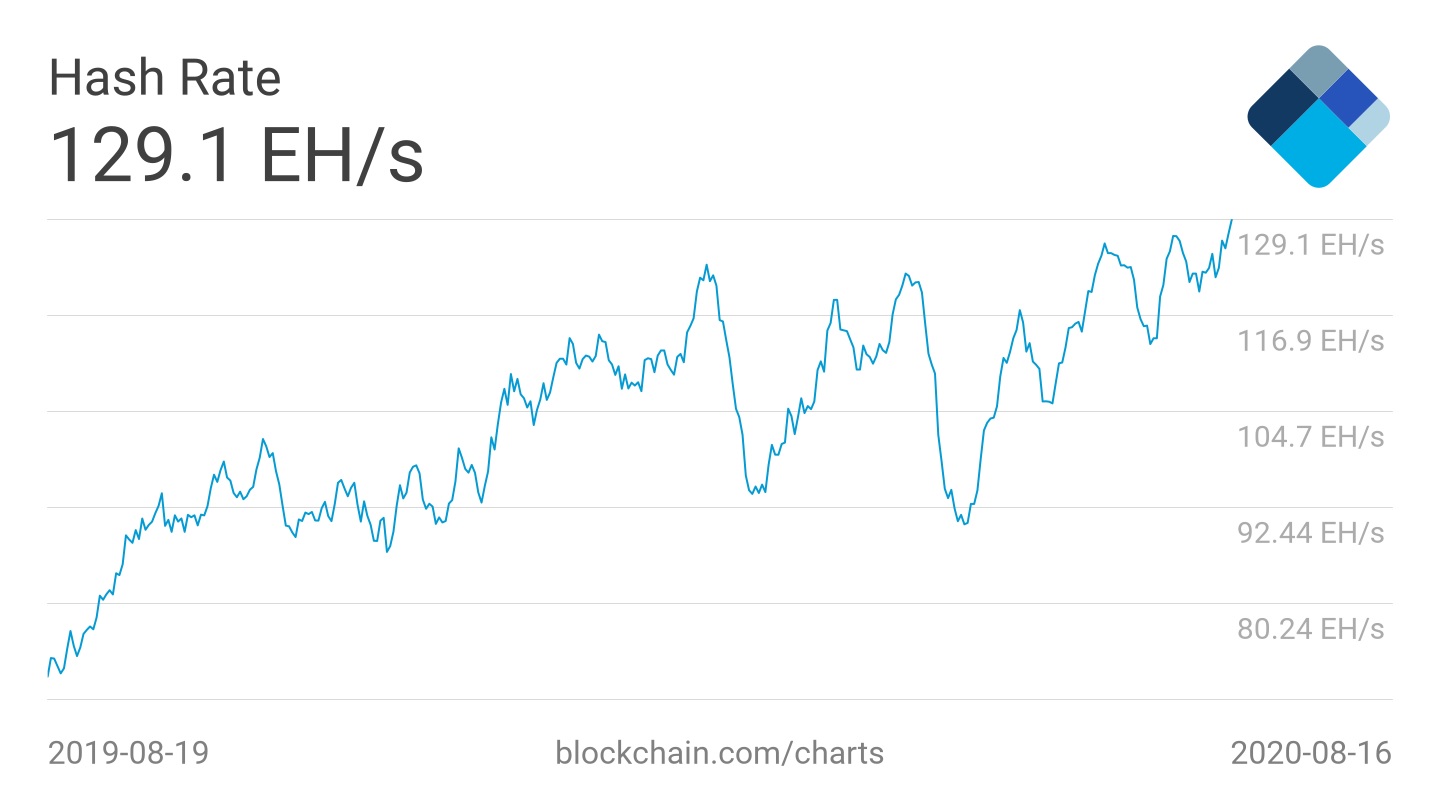
Historical high hash rate leads difficulty
Other than sharp rise in price, the fundamentals of Bitcoin remain strong. Beginning this week, Bitcoin’s network hash rate was hovering near record high level of 129 exahashes per second (EH/S). Hash rate reflects the aggregate computing power employed by miners to validate blocks and confirm transactions. The behavior of miners has a huge impact on the hash rate. That explains the hash rate volatility. Last week, a mining pool sent 800 Bitcoins to Binance cryptocurrency exchange, triggering worries of huge sell off. Nevertheless, the overall miner sentiment remains bullish. Network difficulty, also a crucial measure reflecting the strength of Bitcoin’s blockchain network, is all set to rise in another six days, when next adjustment time arrives. That is expected to boost network difficulty to a new high. In general, an increase in network strength has a positive effect on price.

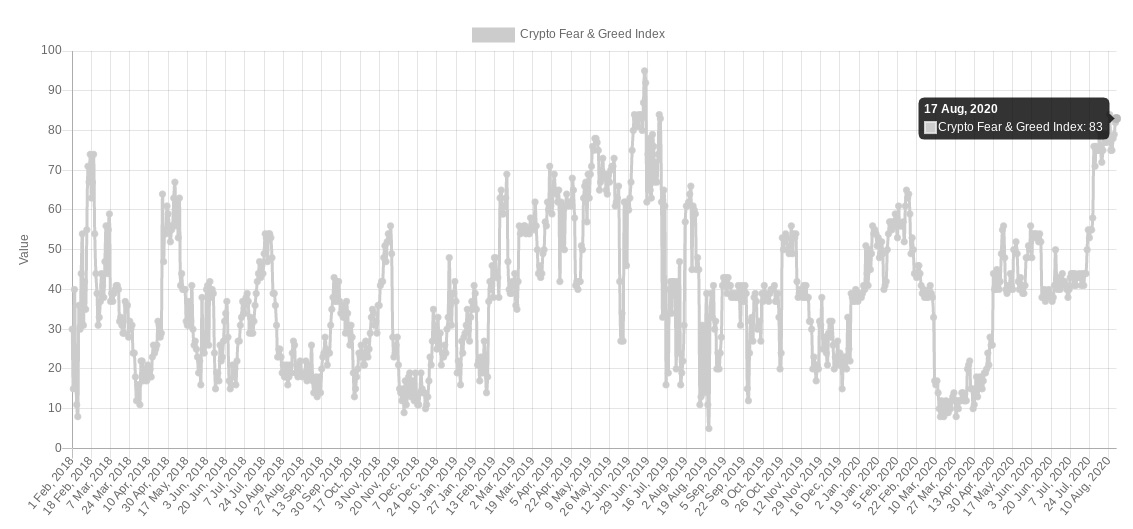
Greed factor
It is probably the only criteria which worry Bitcoin investors at this point in time. The Crypto Fear & Greed Index, calculated using numerous inputs, reflect overall investor sentiment. With a reading of 84 (out of 100), the index currently reflects “greed” among hodlers. The reading is just three points away from record high level of 87 seen in June last year. The index, based on the Fear & Greed Index of conventional markets, gives an idea of likely increase or decrease in volatility.
In particular, the top zone in which the index currently resides indicates that a price correction is due. Back in March, the Index hit a low of 8 as investors were concerned about the strength of Bitcoin, following the crash two weeks earlier.

Forecast by quant analyst PlanB
Popular quant analyst PlanB, who uses Stock-to-Flow price prediction model, expects Bitcoin to hit $14,000 this month. More interestingly, the analyst is forecasting a price of $100,000 in a year. In the meanwhile, PlanB states that chart constructed using Bitcoin’s monthly close since the halving event in May give the immediate price target of $14,000. If attained, it will be the highest-ever monthly close since December 2017.
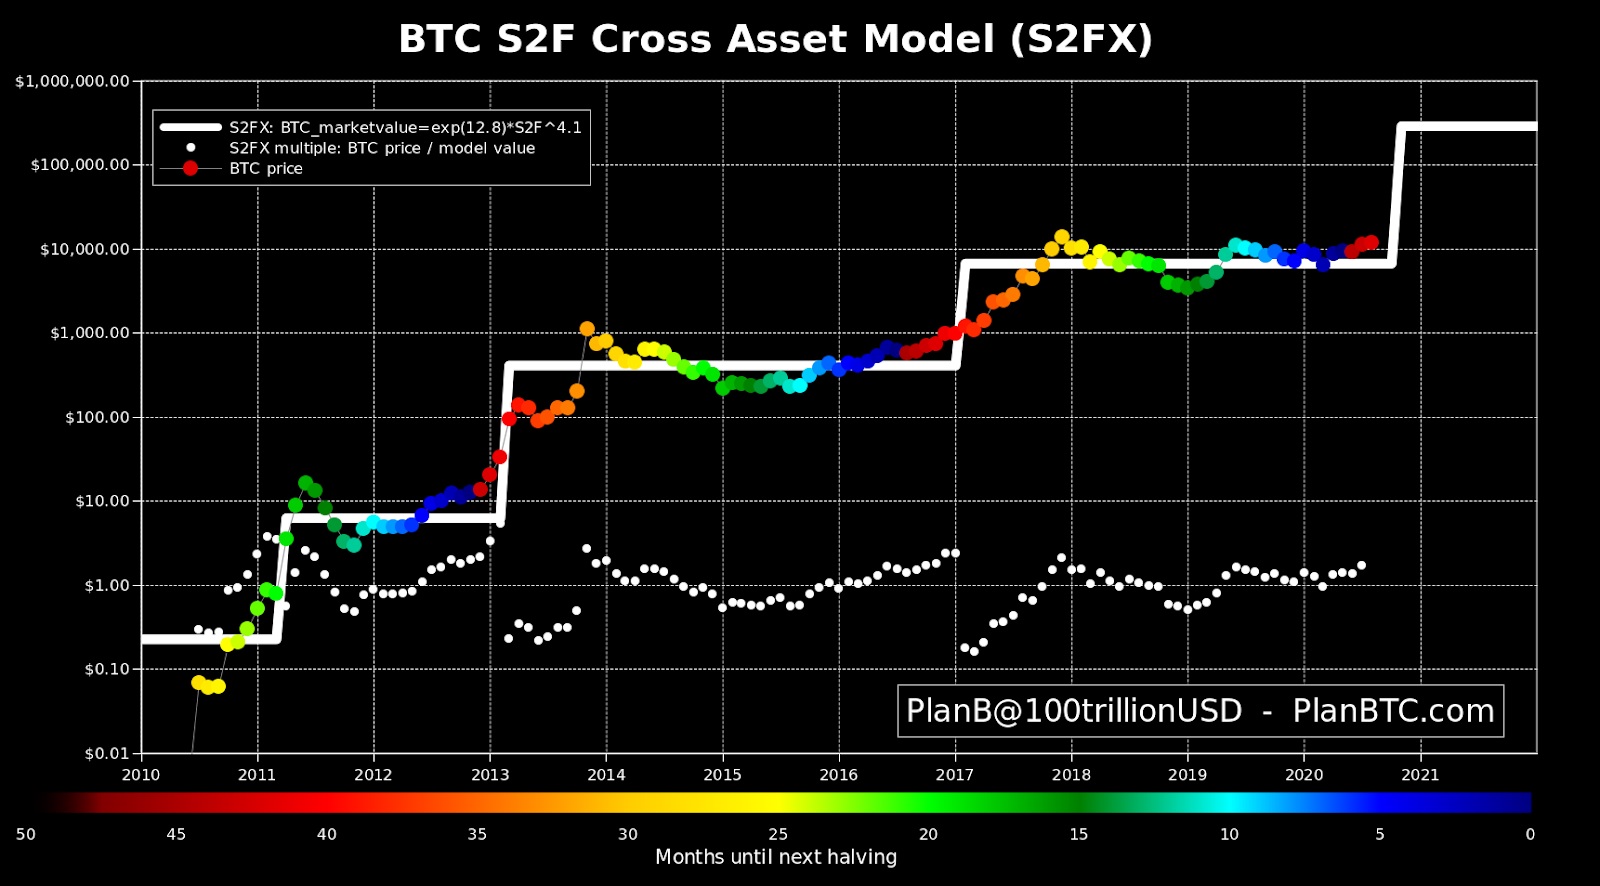

PlanB explained the chart as follows:
“3rd red dot (currently $11850) above 2nd red dot (#bitcoin July close $11356) and above 1st red dot (June close $9132) .. next target: Dec 2017 ATH close $14K.”