In November, the average price of Ethereum (ETH) gas climbed by 1.8%.
In November, 58% fewer ERC-20 tokens were generated on the Ethereum network.
The average number of daily Ethereum transactions has been dropping for over six months.

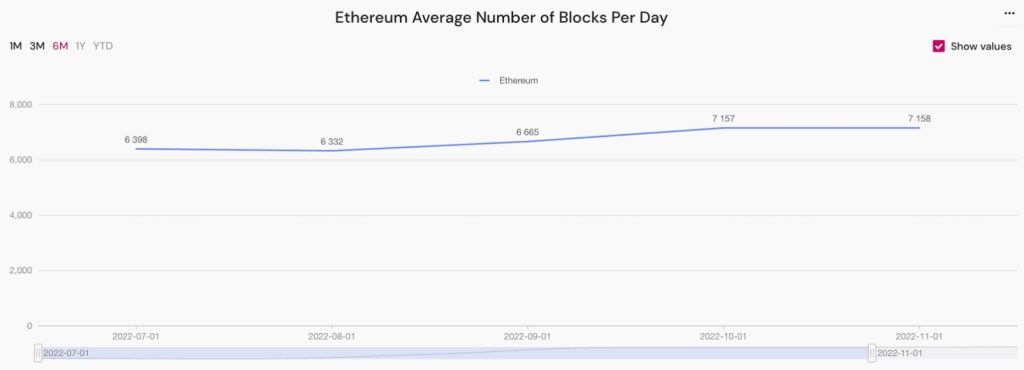
The average number of Ethereum blocks per day has improved by a mere 0.01% in November.
The daily block count and block size remain mostly constant.
In November, the average number of active crypto wallets declined by 7.3% per day, while the average number of active smart contracts climbed by 4%.
Ethereum gas prices statistics
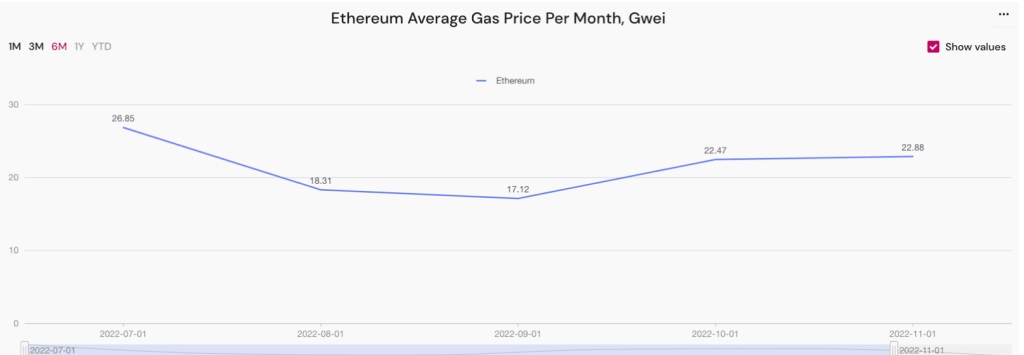
In November, the average Ethereum gas price climbed by 1.8%.
In October, the median price of Ethereum gas was 22.5 gwei. In November, it was 22.9 gwei. The price of gasoline rose by 1.8%.
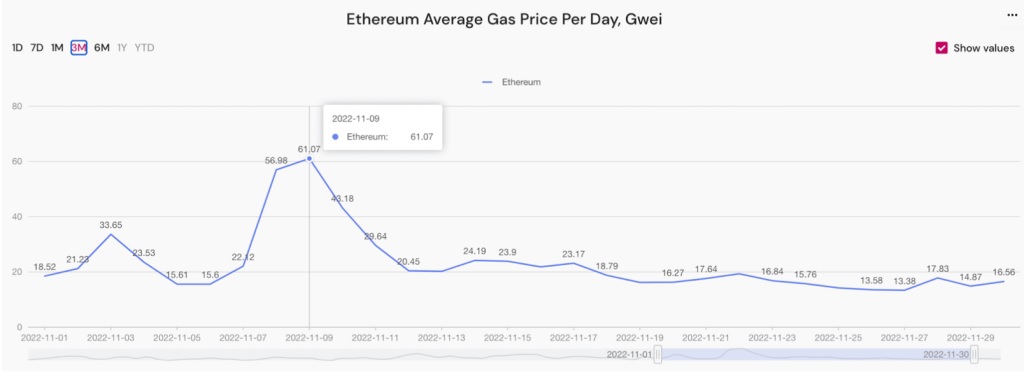
On November 27th, the lowest gas price of the month was reported at 13.4 gwei. On the ninth, the highest recorded value was 61.07 gwei.
Ethereum new smart contracts statistics
In November, 58% fewer ERC-20 tokens were generated on the Ethereum network.
In October, 14,295 ERC-20 tokens were produced on the Ethereum network. In November, this number stood at 9,050. It has fallen by 58%. There is a comparable drop in all chains.

Ethereum transaction statistics
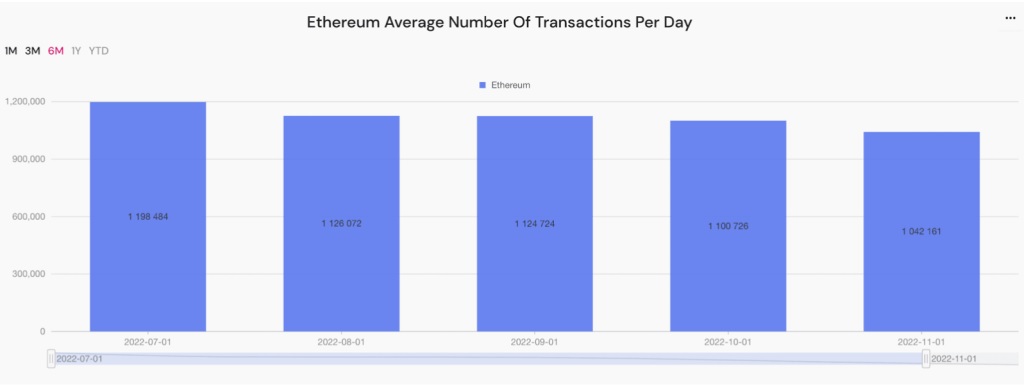
The average number of daily Ethereum transactions has been dropping for over six months.
In October, there were 34,122,532 Ethereum transactions, with an average daily volume of 1,100,726 transactions. In November, there were 31,264,848 total Ethereum transactions, with an average daily volume of 1,042,162 transactions. This number declined by 5.6% during the course of six consecutive months.
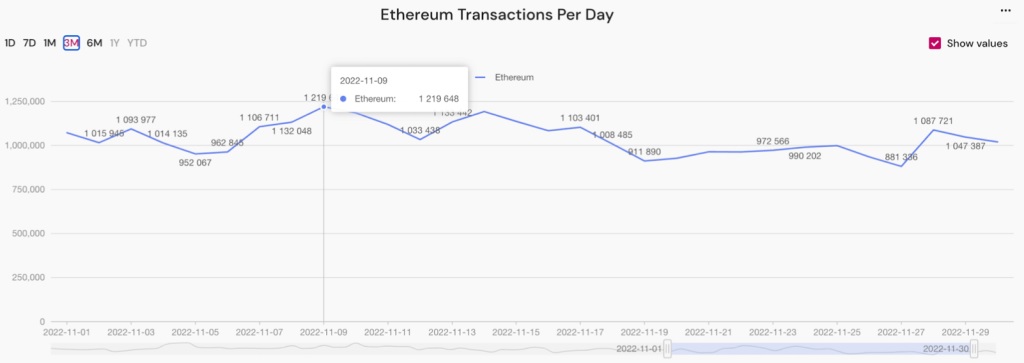
On November ninth, the highest average number of transactions was recorded, with 1,219,648 transactions, which is less than in October 2022.

Ethereum block statistics
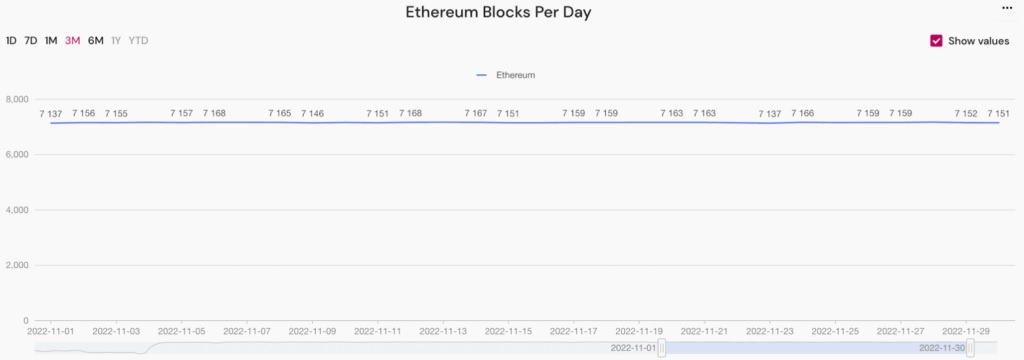
The average number of Ethereum blocks per day changed by just 0.01% in November.
The daily block count and block size remain mostly constant.
In November, the ‘Ethereum average number of blocks per day’ chart displays fascinating data. In October, the average number of Ethereum blocks was 7,157, whereas in November, the average number of Ethereum blocks per day was 7,158. The variance is just one block, or 0.01%.
After ‘The Merge,’ the ‘number of blocks each day’ chart seems to be quite steady.
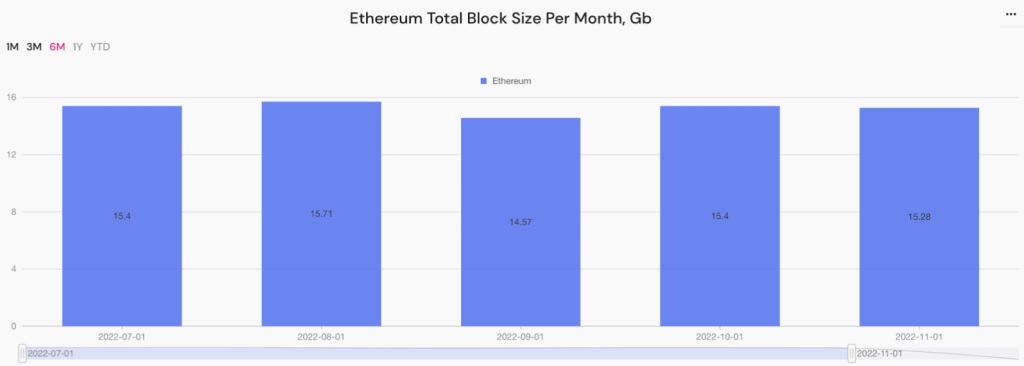
In November, the average block size was 0.51 Gb. During the month of October, this amount was 0.5 Gb. The daily average size of blocks mined has grown by 1.96 percent.
According to the graph titled ‘Ethereum total block size each month, Gb,’ the total block size in November was 15.28 Gb. In October, the amount was 15.4 GB. The value has declined by 0.78 percent.

Ethereum active addresses statistics
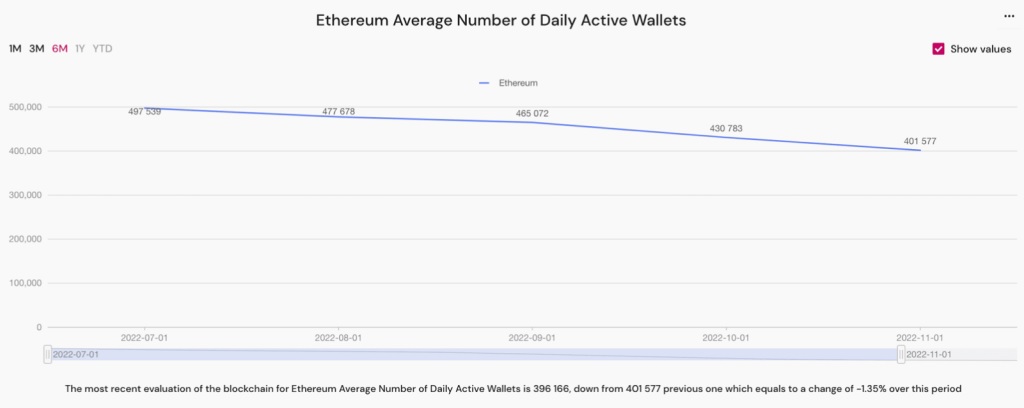
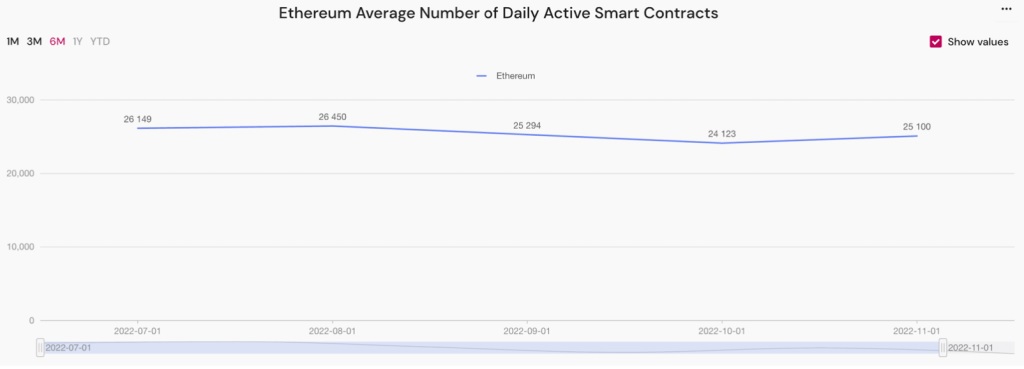
In November, the average number of active crypto wallets declined by 7.3% per day, while the average number of active smart contracts climbed by 4%.
In November, the average daily number of active cryptocurrency wallets on the Ethereum blockchain was 401,577. This number was 430,783 in October, therefore it has decreased by 7.3%. Last month, similar patterns were witnessed.
Consequently, the number of active smart contracts has grown little. In November, this figure was 25,100. The number was 24,123 in October. It represents a four percent gain.


Data-driven conclusions
The record low fluctuations in the number of blocks mined each day in the Ethereum network, as well as the utterly minor changes in block sizes, suggest that the Ethereum chain has thoroughly absorbed the impacts of The Merge and responded accordingly.
November statistics indicate a further fall in network activity at all levels. Most notably, the amount of new ERC-20 tokens produced across all networks has decreased. This number has decreased dramatically.
The globe enters winter, and the earth is ready for the festivities, but crypto winter continues.