
The crypto market moves in repeating waves of highs and lows and offers clear opportunities for those who know the pattern. Bitcoin price dropped from an all-time high of $69,000 in November 2021 to $15,000 on November 22, 2022, a 78% decline. Then, in 900 days, it rocketed to a new peak of $111,000 by May 2025, marking over 700% gains. So each time the market reaches its bottom, you could spot it and buy as much as you can, and then once it reaches its all-time high, you could know that this is the highest it can get and sell off before anyone else can. But only if you knew how to do it.
Let’s first understand what these market cycles are. The market moves in cycles of highs and lows. It never keeps dipping or keeps rising. Each cycle consists of 4 phases.
The Four Phases of a Crypto Market Cycle
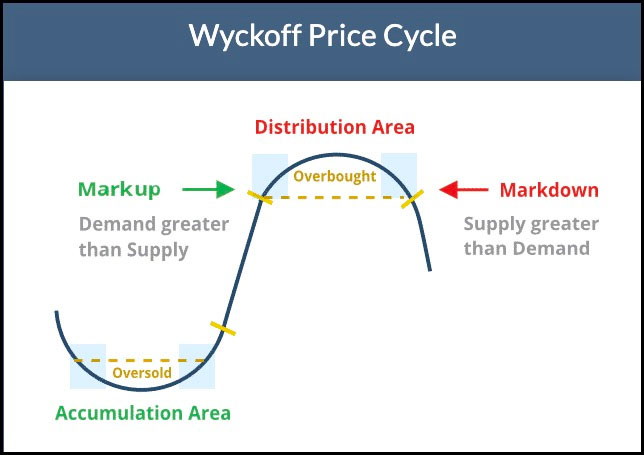
- Accumulation
After a steep downtrend, smart money begins to buy quietly. The chart moves sideways, and volume remains steady. Retail traders stay on the sidelines, so prices move with low volatility, setting the stage for the next level. - Markup
At this stage, you’ll see a series of higher highs and higher lows on your candles. Media headlines turn bullish, and fear-of-missing-out drives new buyers. Momentum accelerates, pushing prices sharply upward. This is where most people make a profit. - Distribution
Institutions and “whales” start to sell silently. The market may plateau or form a double-top pattern. Volume grows on up days but fails to sustain further gains. At this point, insiders lighten their positions before the crowd realizes the run has peaked already. - Markdown
This is the bearish trend as the price turns red. Stop-loss triggers spark cascading sell orders. Eventually, selling pressure eases, and the cycle loops back to accumulation.
Mastering these four moves gives you the roadmap to buy low, sell high, and avoid the fakeouts in between. But the problem is: how to know that we have reached the top or the bottom of the market?
Spotting Top Bottoms and Avoiding Fakeouts in Crypto:
On-Chain Metrics: MVRV & SOPR
On-chain data comes straight from the blockchain, so it rarely lies. Two simple ratios help you spot extremes. The MVRV ratio divides market value by realized value. When it climbs above about 3.2, it means holders sit on massive unrealized gains, think 240 percent profits in April 2021 at Bitcoin’s peak near $64 000. Contrary to that, when MVRV dips below 1.0, as it did in June 2022 around $29 000, it flags deep capitulation and a likely bottom.

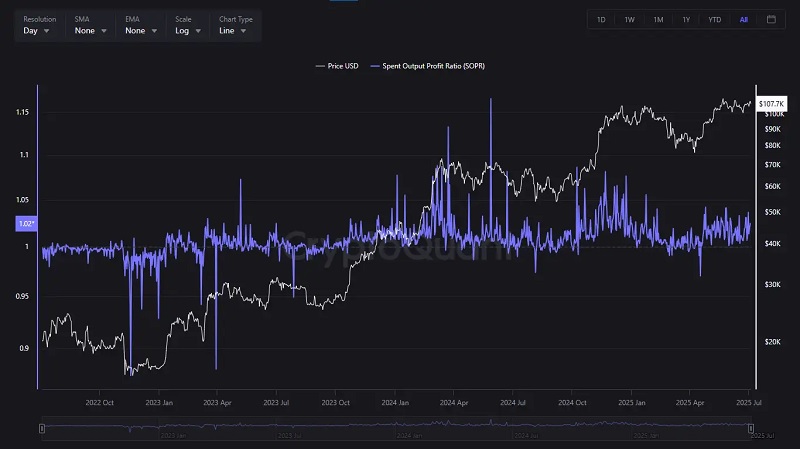
Next, track the Spent Output Profit Ratio (SOPR). A spike above 1.2 tells you coins are moving at a profit, a classic sign that traders cash out and a top nears. When SOPR falls under 1.0, it shows coins trade below their purchase price, a clear signal to buy into your position as fear sets in in the crypto market.
Technical Indicators: Mayer Multiple and Puell
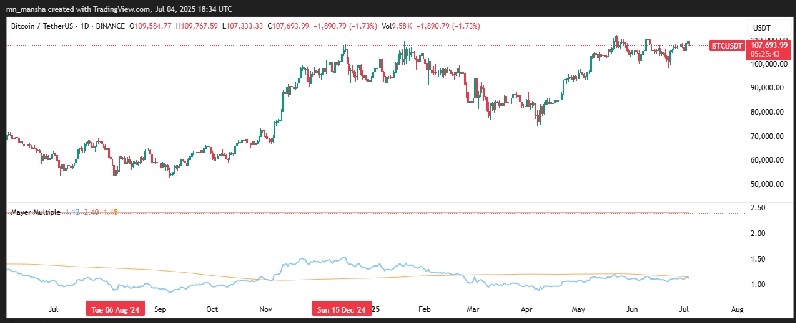
Technical tools add an additional layer to verify your analysis. The Mayer Multiple divides price by its 200-day moving average. Whenever it spikes above about 2.4, as it did on August 6, 2024, the price tends to top out and roll over. When it dips below 0.8, you hit a rock-bottom buy zone.
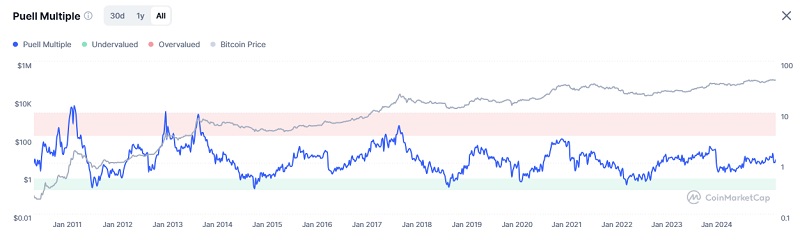
On CoinMarketCap, the Puell Multiple tracks miner revenue against its 365-day average. When it jumps into red, miners cash out, it is usually the top of the market. When it drops into green, miner capitulation starts and signals the bottom of the market.
You should also keep an eye on the social indicators and the fear and greed index. If the index is above 80, the market is already overbought, and it is the sell. Likewise, if the index is anywhere below 15, extreme fear, this is the time to buy into the market.
Avoiding Fakeouts in Crypto Markets
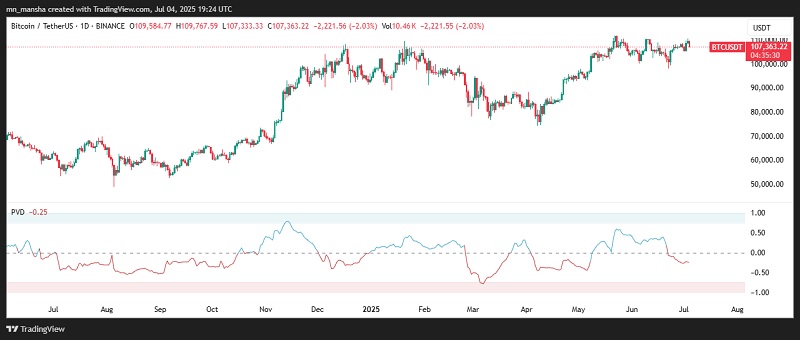
Markets love to trick you; however, you can leverage some indicators and tools to outsmart them. The Price Volume Divergence (PVD) indicator shows whether volume backs the move. When the price spikes but PVD falls below zero, you face a fakeout trap.
Order-book heatmaps reveal hidden walls of resting orders. A breakout above $108,500 stalled against a thick sell wall on Binance before collapsing. Wait for the price to absorb those levels before chasing breakouts. Finally, watch whale activity. Large dormant wallets can dump billions in minutes. A whale that moved 20,000 BTC after 14 years of holding triggered massive distribution within 24 hours, crashing Bitcoin with entire crypto market.
By combining these on-chain metrics, technical indicators, and sentiment cues, you can pinpoint real tops and bottoms and sidestep fakeouts. Understanding these indicators and applying it to Bitcoin price movements can help traders secure maximum gains and mitigate the risk.